Sensitivity plot
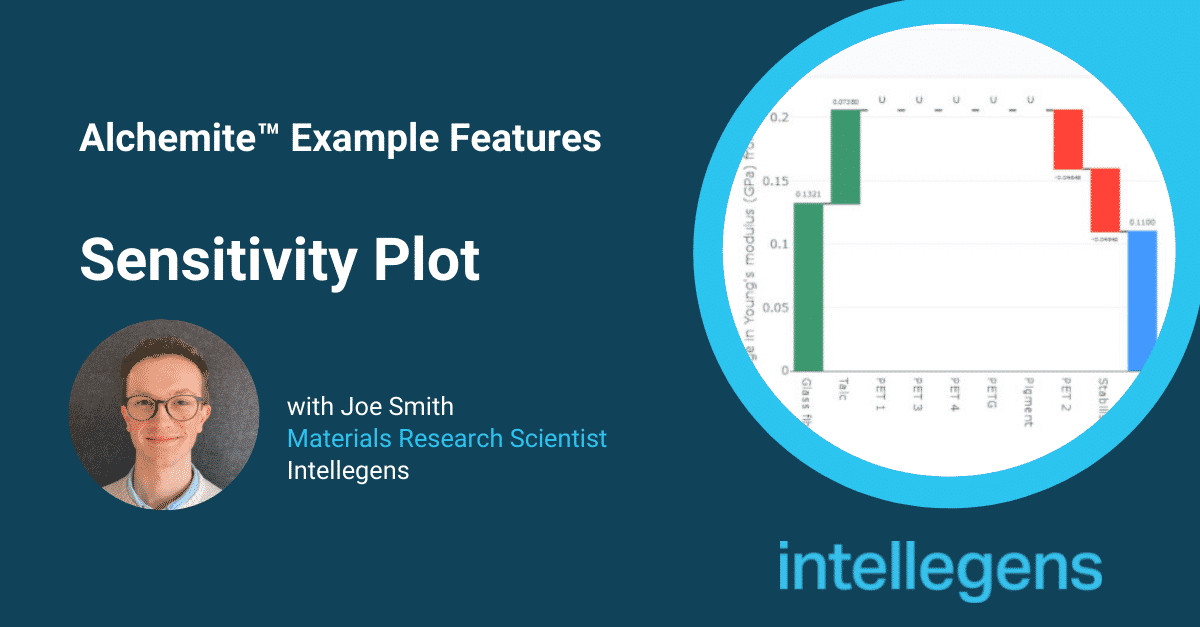
Check out one of the ‘Explainable AI’ features in the Alchemite™ Analytics platform. This new video demo shows the recently-added sensitivity plot feature, which helps the user to understand how variations in the inputs will impact the outputs for a particular material, formulation, or process.
Want to find out more? Read about Alchemite™ Analytics or watch a demo:
