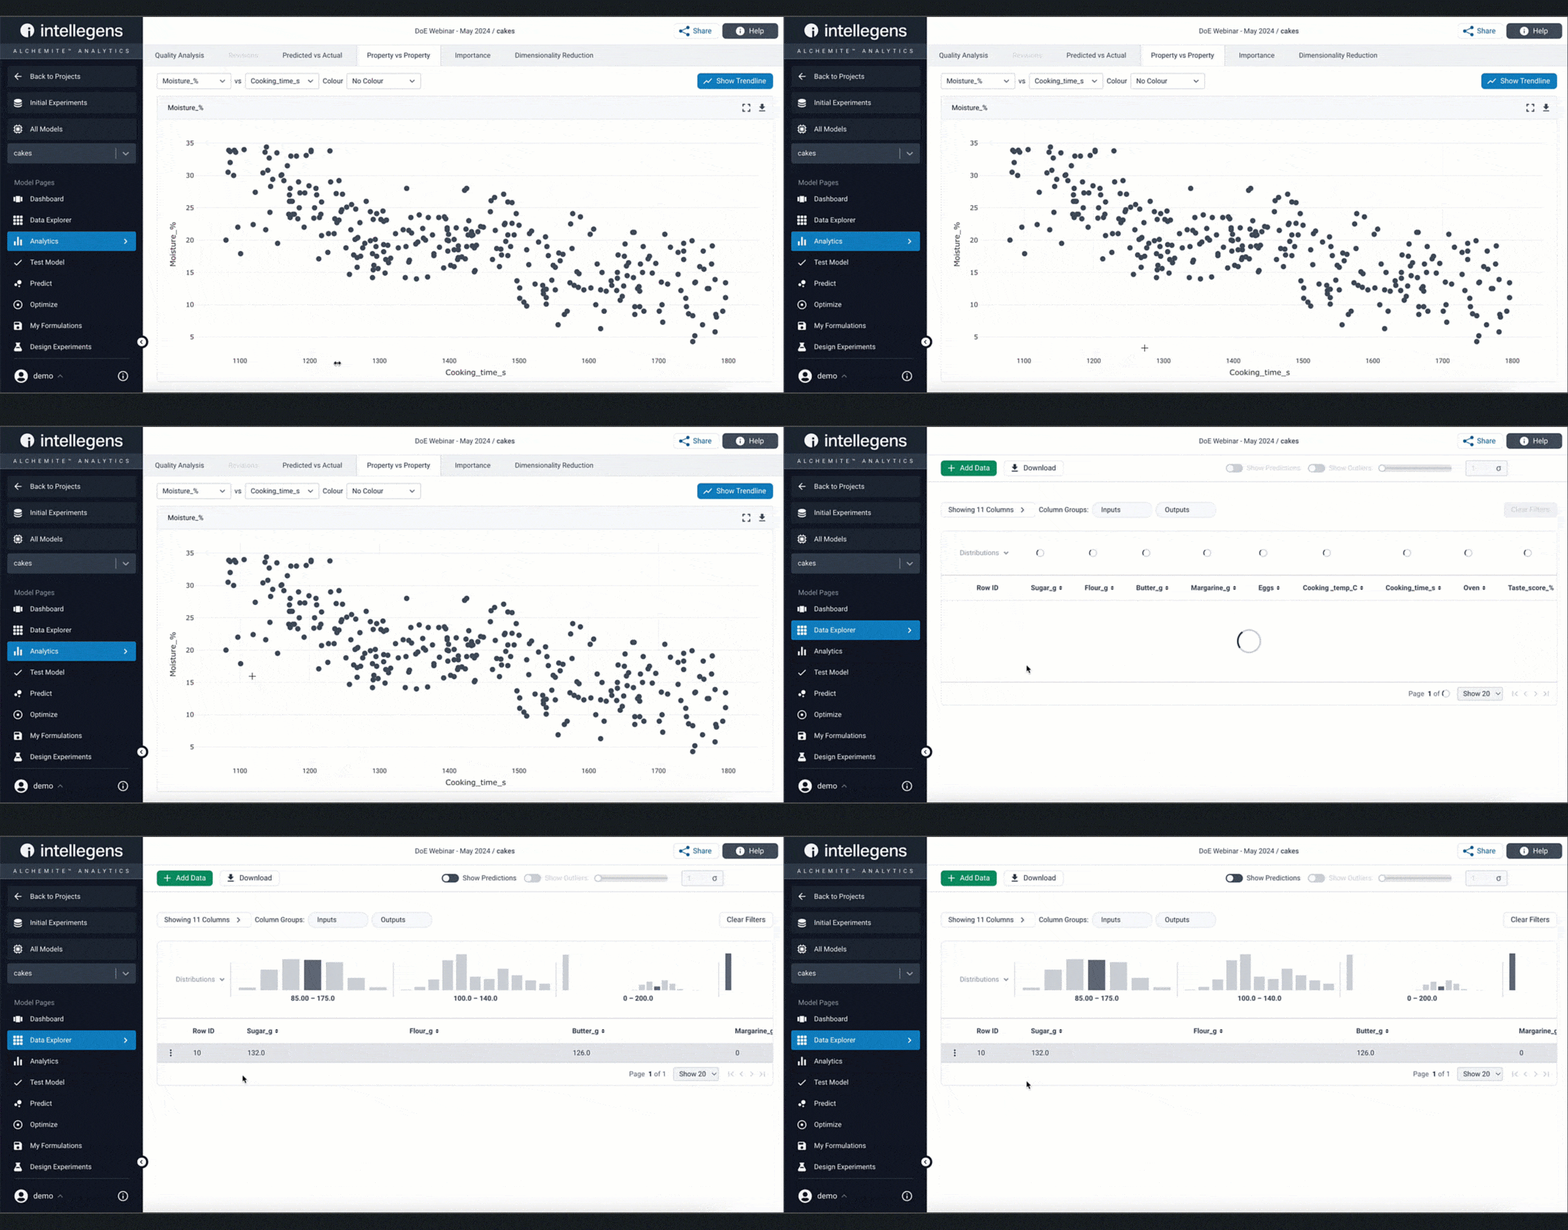
Alchemite™ provides a range of graphical analytics tools, enabling you to explore your data and the relationships identified by the machine learning model. Enhanced interactivity helps you get to the answers that you need, faster.
‘Property vs Property’ and ‘Predicted vs Actual’ plots are easy ways to visualise your dataset, understanding the relationships between properties and between real experimental data points and those predicted by machine learning. Now, you can click on any data point in these plots and instantly see the underlying data and summary statistics. This enables you, for example, to easily identify outlier points in the data and understand what is behind them.

Get a demo
The ‘explainable AI’ analytics tools are one of many in features Alchemite™ Analytics for applying powerful machine learning capabilities to the development of chemicals, formulations, materials, and processes. If you are not currently a user, why not request a demonstration of Alchemite™ Analytics tailored to your application area?