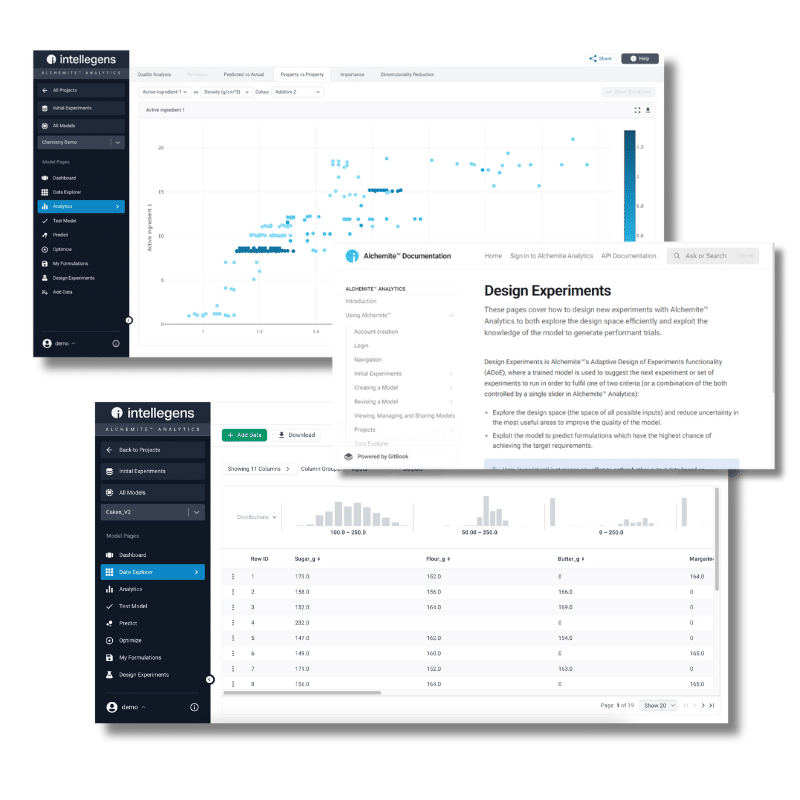
Spring 2024 brings a new milestone release of the Alchemite™ software, applying machine learning to accelerate R&D for applications across chemicals, materials, formulated products, life sciences, and manufacturing. This release brings together the many new features delivered over the past six months under three main themes.
Making it even easier – optimised workflows for tasks including Design of Experiments plus new support resources enable new users to get productive, fast.
Manage real, dynamic projects – new project and model management capabilities support collaborative environments in which project knowledge is always evolving.
Smart new visualisations for key insights – new analytics and greater interactivity allow users to understand relationships in their data and apply them to make smart decisions.
What’s new?
Making it even easier
New learning resources
New context-relevant help accessible via a single button-click on every page in the Alchemite™ Analytics user interface makes it easier to learn as you go. New demo datasets help you to get started with Alchemite™ even if you don’t yet have your own data to analyse.
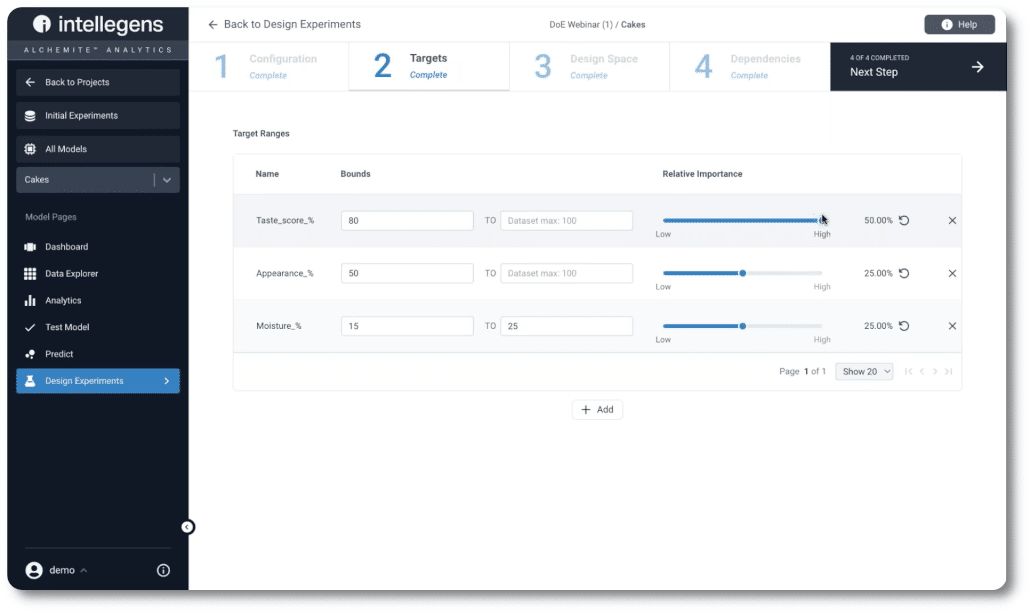
Design of Experiments (DOE) workflow enhancements
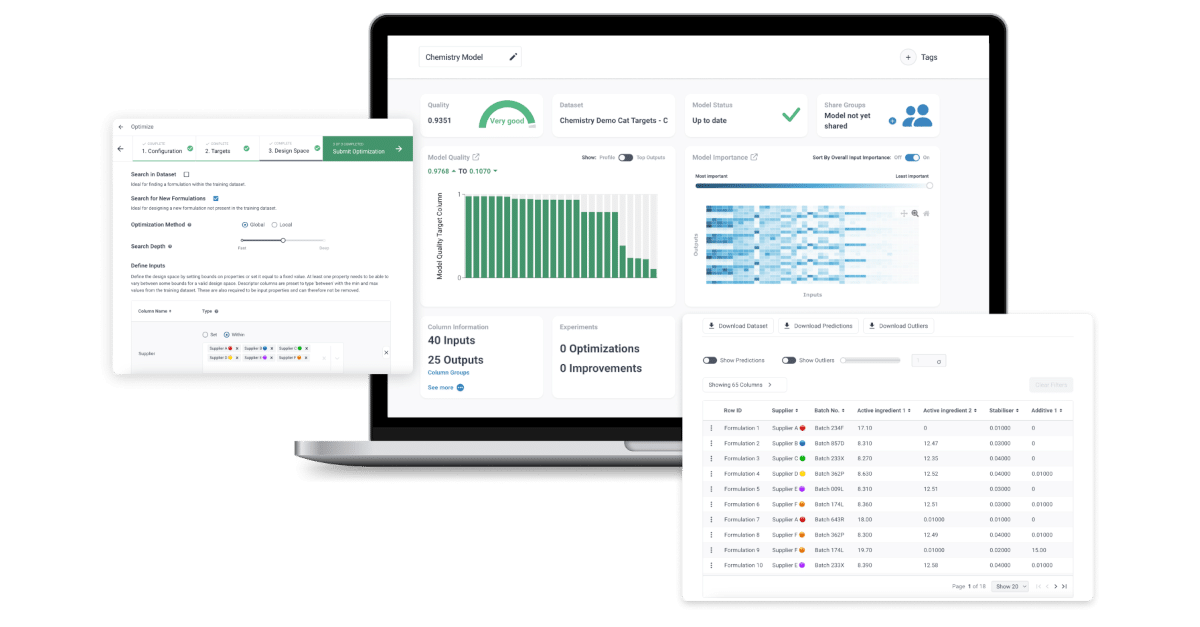
Re-use previous DOE configurations with a different model, speeding-up DOE setup and enabling past experience to be shared. Alchemite™ can now be constrained to suggest only specified discrete values when proposing experiments, saving time and supporting automation by ensuring suggestions can be replicated in the lab. It’s also now simple to plot suggested experiments against existing data, aiding decisions on which experiments to try.
Do more, faster
We’re always making small improvements that remove barriers to the quick, effective use of Alchemite™. For example, larger datasets (<10Mb) can now be uploaded directly through the user interface without requiring use of the API tools.
Manage real, dynamic projects
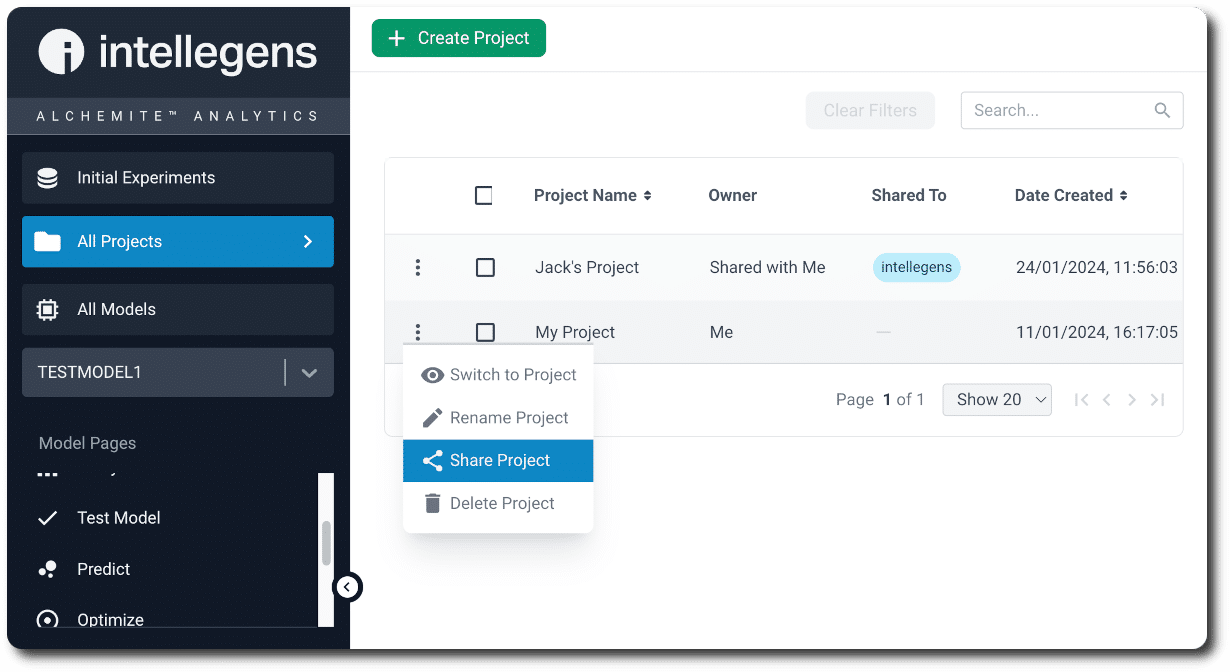
Enhancing the collaborative environment
A new system for organising Alchemite™ models lets you group and share them for future re-use. This both makes it faster for individual users to find previous work for analysis or to support new projects, and enables more effective collaboration.
Managing revisions
A key capability of Alchemite™ is its ability to explore ‘what if’ scenarios and to iterate based on new data. This can require frequent updates to models or exploration of alternative scenarios. New tools to manage model revisions and understand the relationships between models make this process easy.
Model history
You might want to delve into how a model has changed over time, for example, to gain more insight into exactly which variables are affecting key outcomes. New tools to explore model history and the links between revisions facilitate this process.
Smart new visualisations
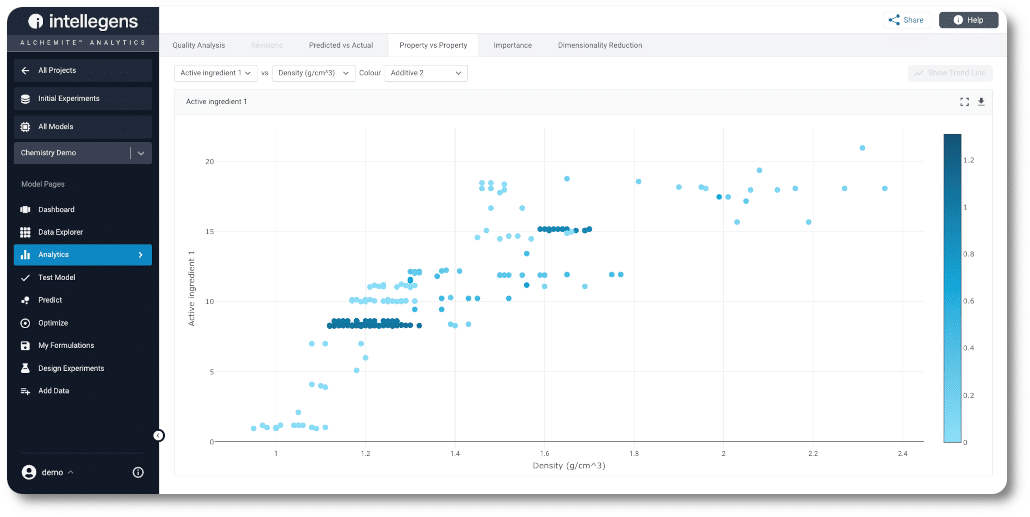
A new dimension to property charts
Property vs Property plots explore relationships between columns in your dataset. A column is displayed on each axis and now an additional column can be displayed by colouring points on the plot, adding a third dimension. Discover key relationships and easily identify outliers in the data.
Interactive plots
Property vs Property and Predicted vs Actual scatter plots have also been made more interactive. Zoom in on an area of interest and click a point to instantly see its underlying data and summary statistics. Get to the answers you need, faster.
Histograms in Data Explorer
Alchemite™ Analytics now provides richer insights as you explore your data. When viewing data, you now see a graphical representation of the distribution of data in each column and can filter based on these distributions.
