I recently met an ex-colleague, someone experienced in the world of computational chemistry, and told him what I was working on now. “That machine learning stuff is pretty interesting,” he said, “but I prefer a model where I can understand what’s going on.”
He had a fair point. And he’d neatly summarised the thinking behind one of the big current Artificial Intelligence (AI) trends, Explainable AI.
Machine learning (ML) is a powerful AI technique, generating models that detect subtle relationships in complex data and that can then be used to predict, optimise, and design the performance of systems in ways not accessible to other methods. But the model itself is a complicated mathematical web. You can’t inspect it, as you might be able to with an equation. It is often seen as a ‘black box’. Once you have trained it, you can validate the outputs that it gives you, but can you understand how it gave you those outputs?

Explainable AI approaches (or ‘Explainable ML’ in the context of machine learning) address such problems. With the right tools, you can access the information you need to build confidence in an ML model and to use it more effectively. In our Alchemite™ software, we’ve given careful thought to two key aspects of Explainable ML.
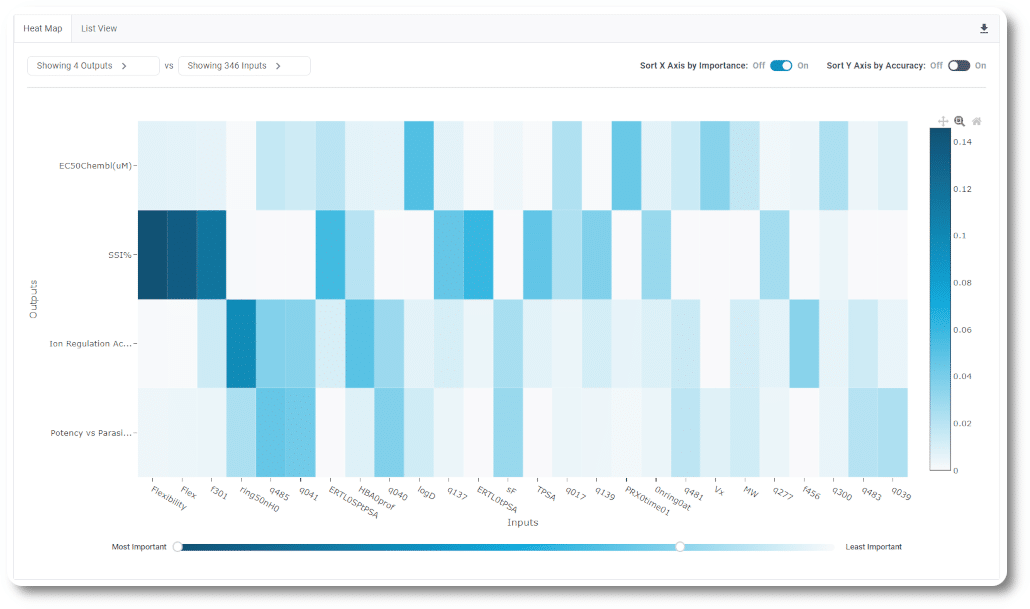
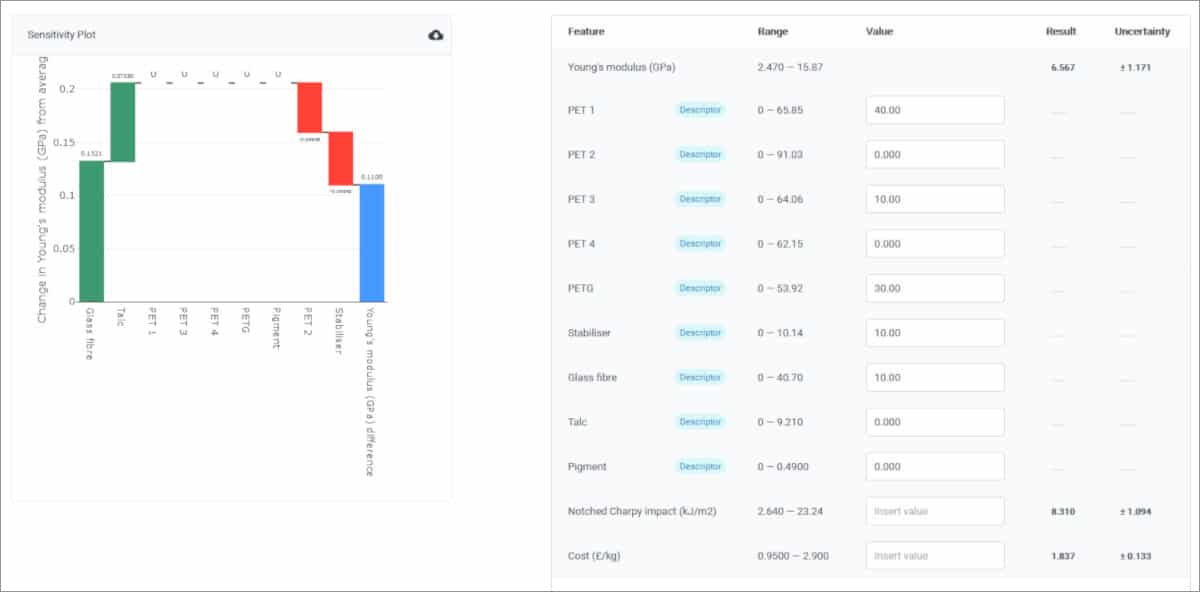
Analytics. Alchemite™ offers a range of plots that deliver insight into what drives the model predictions. Two examples are shown. The importance chart shows a global view of which inputs to a system have the greatest impact on each of the outputs. The sensitivity plot takes the local view, examining how a specific set of inputs corresponding to a particular material or formulation impact the outputs. Thus, although it can’t show you a formula for an ML model, the system can give you the information that you need to understand what is happening – i.e., how the inputs and system parameters drive the outputs.


Uncertainty quantification. For any prediction that it makes, Alchemite™ calculates not a single value, but a probability distribution of possible values. The software displays the expected value, but also a range indicating one standard deviation of this distribution. Accurate reporting of uncertainty helps users to understand the degree of confidence to place in any particular prediction. It also helps them to think through where they may need to focus data acquisition efforts to reduce uncertainty in the model.
Machine learning can be a very useful black box. But, given the right tools, it does not need to be used in this way. Insights that can be gained from the model are particularly useful in domains like materials development, chemistry, and manufacturing processes, where we usually want to use ML iteratively alongside experiment to guide what we are doing, continuously improving both our models and our understanding.
Find out more:

